Home › Services
Services
Six areas of work, one methodology
Carbon, water and energy are handled through a single life cycle view. One product model feeds an EPD, a corporate inventory feeds a reduction programme, and an energy and mass map underpins both efficiency and emissions projects. Each engagement is scoped in writing before it starts.
On this page
Jump to a service
01 · Service
Life Cycle Assessment and EPD
Product models built to ISO 14040/44, and where an EPD is in scope, an EN 15804 declaration taken through verification and publication. Cradle to gate or cradle to grave, on primary data wherever the supply chain allows it.
Scope and functional unit
What the declaration has to cover, which unit results are expressed per, and where the system boundary sits.
Data collection
Bill of materials, process data and energy consumption are taken from the plant. Supplier declarations are read and assessed before they enter the model.
Modelling
The model is built on Ecochain Mobius with the Ecoinvent database. Materials with no direct dataset are modelled as foreground processes from mass and energy balances.
Results, interpretation and sensitivity
Hotspots, contribution analysis and sensitivity runs on the assumptions that drive the result.
EPD and verification
The declaration is prepared to the relevant PCR, submitted to the programme operator and carried through third party verification.
What you receive
- Life cycle assessment report compliant with ISO 14040/44
- Hotspot analysis and a list of reduction opportunities
- Sensitivity and scenario comparisons
- EN 15804 compliant EPD document, where in scope
- Verification and publication process managed on your behalf
- Handover session so the model can be updated in house
Ecochain Mobius · Ecoinvent
02 · Service
Corporate GHG Inventory
Scope 1, 2 and selected Scope 3 categories, calculated and reported under ISO 14064-1 and the GHG Protocol, and structured so that an independent verifier can follow every figure back to its source.
Boundary and approach
Organisational boundary, consolidation approach and reporting period are fixed in writing at the first session.
Source inventory
Every emission source across the sites is listed: stationary combustion, mobile combustion, fugitive releases, purchased energy.
Data collection
Meter readings, invoices and logs are gathered on forms that can be reused next year. Estimated items are flagged as estimates.
Calculation
Location based and market based electricity accounting, and uncertainty assessed by error propagation to give a precision class.
Reporting and verification readiness
The report, the evidence trail and the calculation file are assembled so a verifier can work through them without a second data request.
What you receive
- GHG inventory report compliant with ISO 14064-1
- Results for Scope 1, 2 and the selected Scope 3 categories
- Location based and market based electricity accounting
- Uncertainty assessment and precision class
- Data collection forms and a routine that runs next year
- List of reduction opportunities
Structured for independent verification
03 · Service
CBAM and TR ETS Compliance
Embedded emissions calculated from actual installation data rather than default values, with the monitoring and reporting routine that has to sit behind the declaration. The same infrastructure carries over to TR ETS obligations in Türkiye.
Scope and installation boundary
Which CN codes are in scope, which production routes feed them, and where the installation boundary is drawn.
Monitoring methodology
A methodology document specific to the installation: measurement points, data sources, calculation rules and how each is evidenced.
Precursor data
Supply chain data collection for precursor goods, with forms suppliers can actually complete and a fallback where they cannot.
Calculation and checks
Specific embedded emissions per tonne of goods, with internal consistency checks against production and energy records.
Reporting routine and TR ETS
Output in a format that can be passed to the importer, plus a draft monitoring plan for TR ETS.
What you receive
- Installation specific monitoring and calculation methodology document
- Embedded emissions figure per product
- Precursor supplier data collection forms
- Output in a format that can be passed to the importer
- Comparison note against default values
- Draft monitoring plan for TR ETS
Installation data instead of default values
04 · Service
Energy, Carbon Reduction and Process Improvement
The work that begins where the calculation ends. Energy and mass flows are mapped across the site, the points where consumption concentrates are identified, and reduction options are compared on technical feasibility, capital cost and payback.
Energy and mass flow mapping
Value stream mapping across the production line, so consumption is attached to process steps rather than to the site meter.
Energy analysis and regression
Significant energy users identified through regression against production, and performance targets set from the fitted model.
Improvement options
Heat recovery, material substitution and efficiency measures, each sized against the mapped flows.
Prioritisation
Every measure carried with an estimated saving, an investment figure and a payback period, matched against the emission reduction it delivers.
What you receive
- Energy and mass flow map
- List of significant energy users
- Regression model and performance targets
- Staged list of improvement measures
- Saving, investment and payback estimate for each measure
- Prioritisation table matched to emission reduction
Process engineering depth
05 · Service
Water Efficiency and Water Footprint
A water balance for the site, losses and consumption points identified, and savings potential quantified against best available techniques. Where a management system or a certificate is the objective, the application file is prepared as part of the same work.
Current state and data
Abstraction, supply, process use, discharge and metering are reviewed on site before anything is modelled.
Water balance
Inputs and outputs are reconciled so that unaccounted water becomes visible instead of disappearing into a rounding difference.
Best available techniques and savings potential
Consumption points are compared against sector best available techniques and the realistic saving is quantified.
Water efficiency plan
A five year plan with measures, responsibilities and targets, written so it can be audited.
System, training and certification
ISO 14046 water footprint, ISO 46001 management system, and the application file where a certificate is sought.
What you receive
- Site water balance and consumption point analysis
- Loss identification and breakdown by source
- Best available technique comparison and savings potential
- Five year water efficiency plan
- Training and awareness material
- Certification application file and support with data entry
ISO 14046 · ISO 46001
06 · Service
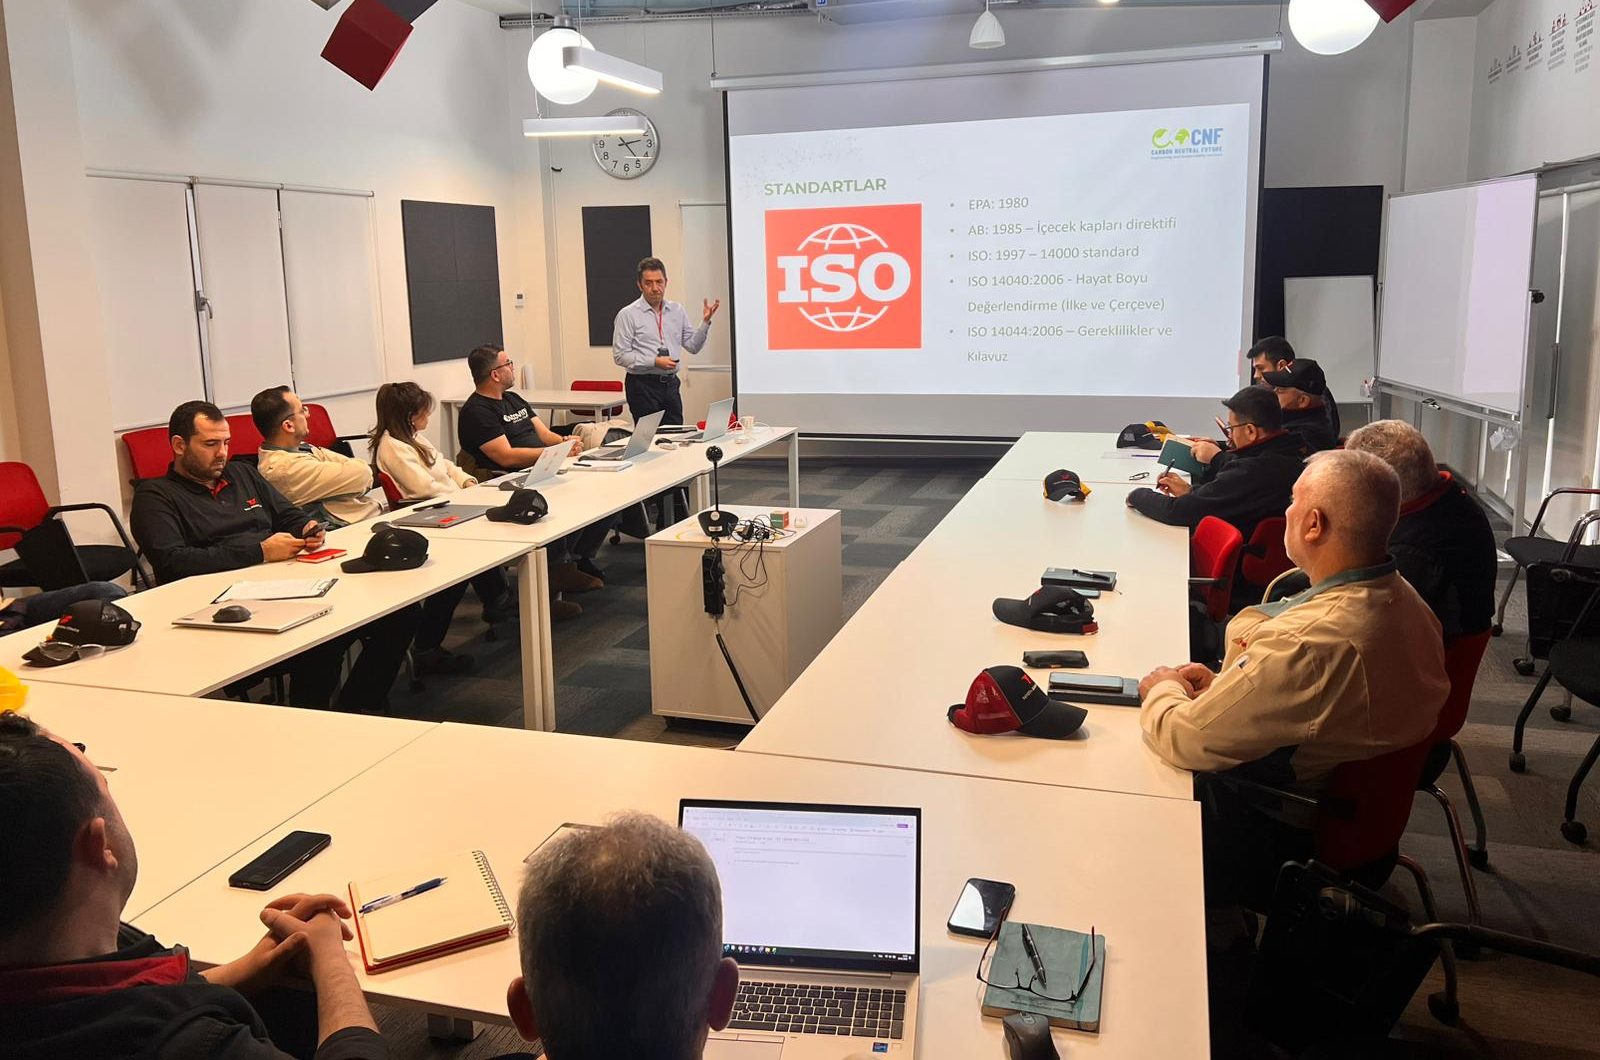
Training
Programmes built so the organisation can carry this work with its own people. Sessions are designed around the participants actually in the room and use worked examples from their own sector, not generic slides.
Scope and level
Who is attending, what they already do with the data, and what they will be expected to produce afterwards.
Programme design
Content and worked examples are built from the organisation's own sector and, where available, its own figures.
Delivery
In-house or open enrolment, with a workshop element so participants leave having completed a calculation rather than watched one.
Afterwards
Question support for a defined period after the session, so the first real attempt does not stall.
What you receive
- Programme designed around the organisation and the participant profile
- Worked examples from the participants' own sector
- Workshop output: a completed sample calculation or category selection table
- Presentation and application notes (PDF)
- Certificate of attendance
- Question support after the session
Hands on, worked examples
Frequently asked